2024 Annual Report
Progress Together


Business Highlights

Growth and Diversification
In 2024, DUCA made strategic choices to position itself for sustainable, long-term growth in a shifting economic and regulatory environment. We prioritized strengthening our financial foundation and enhancing our diversified business lines. By optimizing our balance sheet and reinforcing our capital position, we are setting the stage for future expansion while maintaining financial stability.
Our approach is already driving positive momentum:
- Business Banking expanded by $30 million, reaching $73 million.
- Specialized Lending grew by $142 million, totaling $397 million.
- Continental Currency Exchange (CCE) grew earnings by 16% year over year.
- Wealth Management assets under administration reached $708 million
Total deposits reached $6.2 billion, and total assets under management including Wealth Management assets under administration stood at $8.25 billion.
Looking ahead, DUCA remains committed to diversified, profitable growth. This strategy, aligned with industry trends, allows us to invest in people, technology, and Member-focused solutions that will drive long-term success.
As we continue to grow, our focus remains on strengthening our financial position, enhancing Member value, and delivering innovative products and services that empower Members to do more, be more, and achieve more. Because at DUCA, progress isn’t just about numbers—it’s about moving forward, together.
Engaging Our Employees
At DUCA, we’re committed to fostering a culture that encourages collaboration, growth, and continuous improvement. In 2024, we continued to take meaningful steps to enhance our workplace environment while navigating some challenges.
Employee Experience Team
Our Employee Experience Team (EET) plays a vital role in shaping the Employee experience at DUCA by providing valuable insights to our Executive Leadership Team. The EET helps interpret feedback received through our Employee Feedback to Action Loops, offering recommendations on both existing and new initiatives aimed at improving our team’s experience.
In 2024, the EET contributed to several key initiatives, including refining the goal-setting process, advising on a career development initiative, providing input on policy and procedure documentation, and helping shape the Employee Sentiment Survey. The EET serves as an essential bridge between Employees and leadership, ensuring that feedback is heard, prioritized, and acted upon.
Employee Sentiment Survey
To further understand Employee perspectives, we conducted an Employee Sentiment Survey in 2024, with a solid participation rate of 76%. The survey aimed to assess how well we embody Our Values across the organization. Reflecting the strength of DUCA’s culture, over 80% of Employees agreed that within their branch or department, they consistently demonstrate Our Values in Action such as, Listening and seeking to understand each other’s perspectives and needs; Supporting and encouraging one another’s success; and Adapting and pivoting when needed, among others.
Employee feedback highlighted DUCA’s strong, values-driven culture. Opportunities for improvement were noted, particularly around workload and staffing, which will remain key areas of focus moving forward.
Retail Training Cohorts
2024 marked the launch of DUCA’s Retail Onboarding Program, designed by our Learning Team in collaboration with Branch and Member Connect teams. This two-week program, delivered through a combination of in-person training, hands-on practice, and interactive discussions, was successfully completed by four cohorts in its inaugural year. Participant feedback has been overwhelmingly positive, reinforcing the program’s role as an essential component of onboarding new retail Employees and equipping them for success in their roles.
Integrating the United Employees Credit Union team
As we completed our merger with United Employees Credit Union, we proudly welcomed former United Employees to DUCA. Throughout the transition, our teams collaborated closely to navigate the integration of over 3000 United Members to DUCA. We are also pleased to have expanded the DUCA team with two new branches and their dedicated Employees.
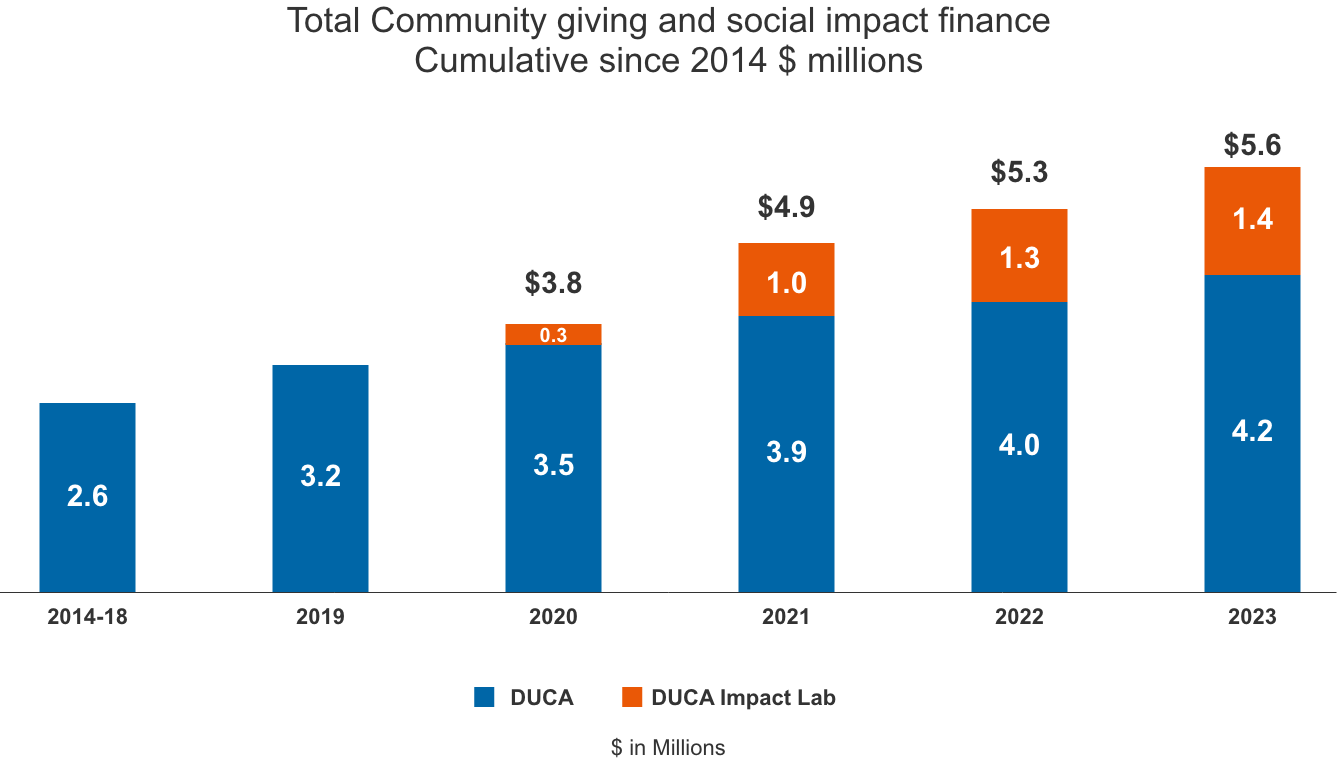
DUCA Impact Lab
Creating New Opportunities for Fair Banking
Banks play a crucial role in everyday life. They provide financial services that help with housing, education, transportation, retirement, and other major milestones. For most people, banking is a key resource that helps them reach their goals and overcome challenges. It is one of the most powerful tools available to improve prosperity and wellbeing.
Fair access to banking services is essential for society as a whole. However, many people face barriers to fair banking—not only due to credit scores or wealth but also because of factors like race, gender, or reliance on gig work. These barriers prevent people from reaching their financial potential and leave many Communities vulnerable.
When more individuals and businesses face financial hardship, society misses opportunities to improve wellbeing, increase economic and social mobility, and drive innovation and productivity.
The DUCA Impact Lab: Driving Change in Fair Banking
The DUCA Impact Lab (DIL), a registered charity established by DUCA, is working to transform financial services. Through grants, research, and partnerships, the DIL pilots and tests lending solutions focused on impact. Its work aims to improve financial wellbeing, expand fair access to banking, reduce financial vulnerability, and measure the social value created. With support from DUCA and partner Credit Unions, the DIL is on a mission to "Build Banking that Benefits All."
The DUCA Impact Lab in Action: The Escalator Loan Pilot
A key focus of the DIL is working with community and technology partners to develop and test new banking models. These efforts provide insights on how to include more financially vulnerable Canadians in fair banking opportunities.
The Escalator Loan Pilot helps individuals trapped in high-cost predatory loans by offering refinancing options with better terms tailored to their financial situation.
By the end of 2024, the Escalator Loan program has:
- Refinanced $759,313 in predatory loans across 115 loans.
- Provided loans with an average size of approximately $6,300 and an average term of 37 months.
- Assisted individuals who typically would not qualify for mainstream financing, with an average income under $40,000 and an average credit score of 607 (most below 600).
The impacts for escalator loan recipients have been remarkable:
- Lower interest rates: Borrowers’ average rate decreased from 58.01% to 8.91%.
- Significant savings: The program has generated over $1,149,571 in interest savings, redirecting funds from American-owned predatory lenders to individuals and local economies in Ontario and Canada.
- Social Return on Investment (SROI): When measured using the SROI framework, we can
quantify improvements in wellbeing for borrowers, including:
- $2 million in social value created over the loan term, mainly from improved mental and financial health.
- $1 million in additional social value post-loan term, due to lasting improvements in financial and mental wellbeing.
- High impact efficiency: With low operating costs and a manageable default rate, the program delivers $12 in social value for every $1 invested by DUCA—an exceptional return.
Expanding Collaboration with Credit Unions
A major milestone in 2024 was the launch of a unique collaboration between the DIL and other Credit Unions to expand and refine the Escalator Loan program. The initial innovation group includes Kindred Credit Union and Your Neighbourhood Credit Union. Alongside the DIL, they bring together expertise from their Credit and Collections, Marketing, and Social Impact teams to partake in an advisory group that aims to enhance and scale the program, ensuring that more Credit Union Members benefit from these financial services.
By fostering these partnerships, the DIL is leading the way toward a more inclusive and fair financial system—one that empowers individuals, strengthens Communities, and fuels long-term prosperity.
Environmental, Social & Governance (ESG) and DUCA’s Profits with a Purpose
ESG & Profits with a Purpose
At the core of DUCA’s purpose—to help People, Businesses, and Communities do more, be more, and achieve more—is a commitment to ensuring that those impacted by DUCA are left better off as a result. We strive to create a banking experience that positively influences the wellbeing of our stakeholders, encompassing not only financial prosperity but also financial health, stability, and an improved quality of life.
A focus on wellbeing has long been embedded in DUCA’s values, and we continue to evolve how we measure our impact. In 2017, DUCA became the first B Corp-certified Credit Union in the world, demonstrating our commitment to objectively assessing our social, environmental, and governance performance against some of the highest standards available at the time. While this remains a key part of our measurement approach, we have also begun identifying the most significant opportunities for Credit Unions to contribute to overall wellbeing.
Environmental
For the first time in 2024, DUCA partnered with Carbonhound to establish a baseline measurement of our Scope 1 and Scope 2 carbon emissions. The results of this assessment, detailed below, will serve as a benchmark for tracking our progress in the years ahead.
In 2024, DUCA’s total Scope 1 and 2 emissions were 254.47 tonnes of CO2e, primarily driven by stationary combustion (215.499 CO2e), and energy use (38.971 CO2e). Additionally, we initiated an evaluation of our financed emissions across our mortgage, commercial, and business loan portfolios—a process that will continue into 2025 and beyond.
Social
Access to stable and affordable housing is fundamental to overall wellbeing, and supporting individuals in achieving homeownership is a core part of DUCA’s mission. However, life’s unexpected challenges can sometimes limit a person’s access to the funds needed to achieve major milestones, such as purchasing a home—leaving individuals in our Community financially vulnerable.
In 2024, DUCA provided over $1.9 million in bruised credit mortgages to Members facing financial hardship. These loans enabled individuals who might not otherwise qualify for traditional financing to achieve homeownership, helping to create stability and financial resilience within our Community.
Of course, the DUCA Impact Lab remains the primary pillar of our approach to creating positive social change in our Community. By empowering individuals to break free from predatory lenders, we continue to advance our mission of building better banking for all.
DUCA Leadership Team
Executive Leadership Team
-
 Doug Conick
 -
 Yan Xu
 -
 Phil Taylor
 -
 Karey Carson
 -
 Pippa Nutt
-
 Riz Ahmad
 -
 Aron Rogers
 -
 Michael Creasor
 -
 Tom Robertson
-
 Mo Mauri
 -
 Afzal Hussain
Board of Directors


Financial Snapshot
| 2020 | 2021 | 2022 | 2023 | 2024 |
|---|
| 1.0 | Key Financial Results and Metrics ($ in thousands) | |||||
| 1.2 | DUCA Net Income | $12,838 | $25,702 | $16,321 | $17,331 | $2,440 |
| 1.3 | ROE1 | 4.1% | 7.4% | 4.4% | 4.8% | 0.7% |
| 1.4 | Efficiency Ratio | 76.5% | 67.9% | 81.8% | 79.2% | 91.2% |
| 1.5 | Leverage Ratio | 7.0% | 6.8% | 6.3% | 5.8% | 5.7% |
| 1.6 | Risk Weighted Ratio | 17.4% | 14.2% | 13.0% | 12.0% | 12.0% |
| 2.0 | Balance Sheet Performance ($ in millions) | |||||
| 2.1 | Assets | $5,112 | $5,522 | $6,936 | $7,672 | $7,547 |
| 2.2 | Loans | $4,129 | $4,848 | $6,411 | $6,929 | $6,565 |
| 2.3 | Deposits | $3,841 | $4,555 | $5,596 | $5,963 | $6,236 |
| 2.4 | Securitization Debt | $698 | $468 | $436 | $824 | $771 |
| 2.5 | Regulatory Capital | $360 | $374 | $443 | $447 | $435 |
| 3.0 | Earnings Performance ($ in thousands) | |||||
| 3.1 | Net Interest Income | $66,789 | $84,294 | $76,949 | $53,516 | $56,921 |
| 3.2 | Fee and other income | $12,282 | $14,412 | $28,143 | $57,953 | $39,441 |
| 3.3 | Provision (Recovery) of Credit Losses | $1,315 | $37 | $(927) | $1,448 | $5,808 |
| 3.4 | Operating Expenses | $60,466 | $67,012 | $85,974 | $88,296 | $87,879 |
| 3.5 | Pre-tax income before patronage | $17,290 | $31,657 | $20,045 | $21,725 | $2,675 |
1 Computed using net income before patronage and other comprehensive income
Corporate Governance

DUCA operates within the context of a robust legislative and regulatory framework. Our corporate governance policies and practices are consistent with requirements of the Credit Unions and Caisses Populaires Act – 2020 (CUCPA-2020, the Act), related authority rules and guidance including (not limited to) the Sound Business and Financial Practices Rule, the Capital Adequacy Rule and Liquidity Adequacy Rule. DUCA is regulated by the Financial Services Regulatory Authority of Ontario (FSRA) which oversees market conduct, administers and enforces authority rules of the Act, regulations and guidance, and provides deposit insurance through the Deposit Insurance Reserve Fund (DIRF) for deposits held at Ontario Credit Unions and Caisse Populaires up to prescribed limits. Within this context, the Board of Directors (the Board) approach to corporate governance is informed by the following guiding principles:
Values & purpose driven: The Board reinforces and champions the Credit Union’s organizational Values acting in a fashion that demonstrates trust, integrity and good governance. The Board’s governance and oversight ultimately supports the realization of DUCA’s purpose - to help Members and Communities Do More, Be More and Achieve More. Values and purpose alignment enables the delivery of optimal and sustainable outcomes for Members, Employees, Communities and Stakeholders.
Stewardship: We act in the best interests of our Members, the Credit Union and our stakeholders. We do this by following sound business and governance practices in our policy and procedure frameworks and fostering an environment of integrity. We exercise independent, sound, and unbiased judgement in our oversight and the constructive challenge, and support of management.
Strategic clarity: The Board ensures DUCA has a clear and focused strategy supported by business priorities, goals, initiatives, and the financial and human capital resources necessary to successfully achieve its vision and fulfill its purpose.
Effective oversight: The Board ensures its effective oversight of the risk profile of the Credit Union relative to its risk appetite, through enterprise risk and compliance management frameworks, policies and procedures. The Board also reviews and monitors DUCA’s enterprise-wide operational, business, and strategic risks and compliance status as well as its financial performance. Our oversight ensures DUCA operates within its risk appetite and in a fashion that results in an appropriate balance of return for risks.
Improvement mindset: We are committed to continually improving governance and oversight principles, policies and practices. An improvement mindset helps the Board serve the best interests of Members and all stakeholders in the context of evolving Member and Community needs as well as dynamic operational, technological, regulatory, competitive, and economic environments. We enable improvements through regular evaluations of Board effectiveness, seeking third-party advice, and ongoing education and training of Directors of the Board.
 Audit Committee
 Nominations Committee
 Governance Committee
 HR & Compensation Committee
 Risk Committee
Audit Committee
Standing committee of the Board to which the Board had delegated responsibility for overseeing DUCA’s financial reporting, control environment, and compliance.
The role of the Committee is to oversee and assess the:
a) Integrity of the financial reporting process and
financial statements;
b) Adequacy of the internal and external audit
functions;
c) Adequacy and effectiveness of the risk management
process;
d) Compliance with legal and regulatory
requirements;
e) External auditor’s qualifications and
independence;
f) Performance of the external auditors; and
g) Performance of the internal audit function.
Nominations Committee
Standing committee of the Board to which the Board has delegated responsibility for overseeing the Director nomination and election process. The primary role of the Committee is to source, recruit, and oversee the election of Directors to the Board who meet the qualifications for the role and who will address any competency gaps identified in the Board Competency Matrix (as developed by the Governance Committee).
Governance Committee
Standing committee of the Board to which the Board has delegated responsibility for overseeing the quality and effectiveness of DUCA’s corporate governance. The primary role of the Committee is to ensure that the Board of Directors provides for effective governance with respect to the board composition, competency and oversight, as well as monitoring current, and evolving governance best practices.
Human Resources and Compensation Committee
Standing committee of the Board to which the Board has delegated responsibility for overseeing DUCA’s human resources policies. The role of the Committee is to oversee and assess the compensation of the CEO and members of the Executive Leadership Team and to manage the process of evaluating the CEO.
Risk Committee
Standing committee of the Board to which the Board has delegated responsibility for overseeing the effective operation of all risk-taking operations and risk management functions of the Credit Union and ensuring appropriate risk governance processes are executed effectively. The Committee shall review the risk activities of the Credit Union, the associated corporate policies and any significant emerging events and related action plans and shall recommend any improvements or changes to the Board as deemed necessary or desirable.
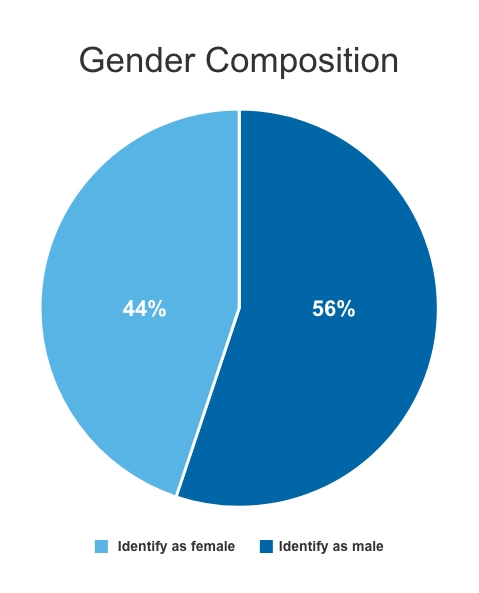
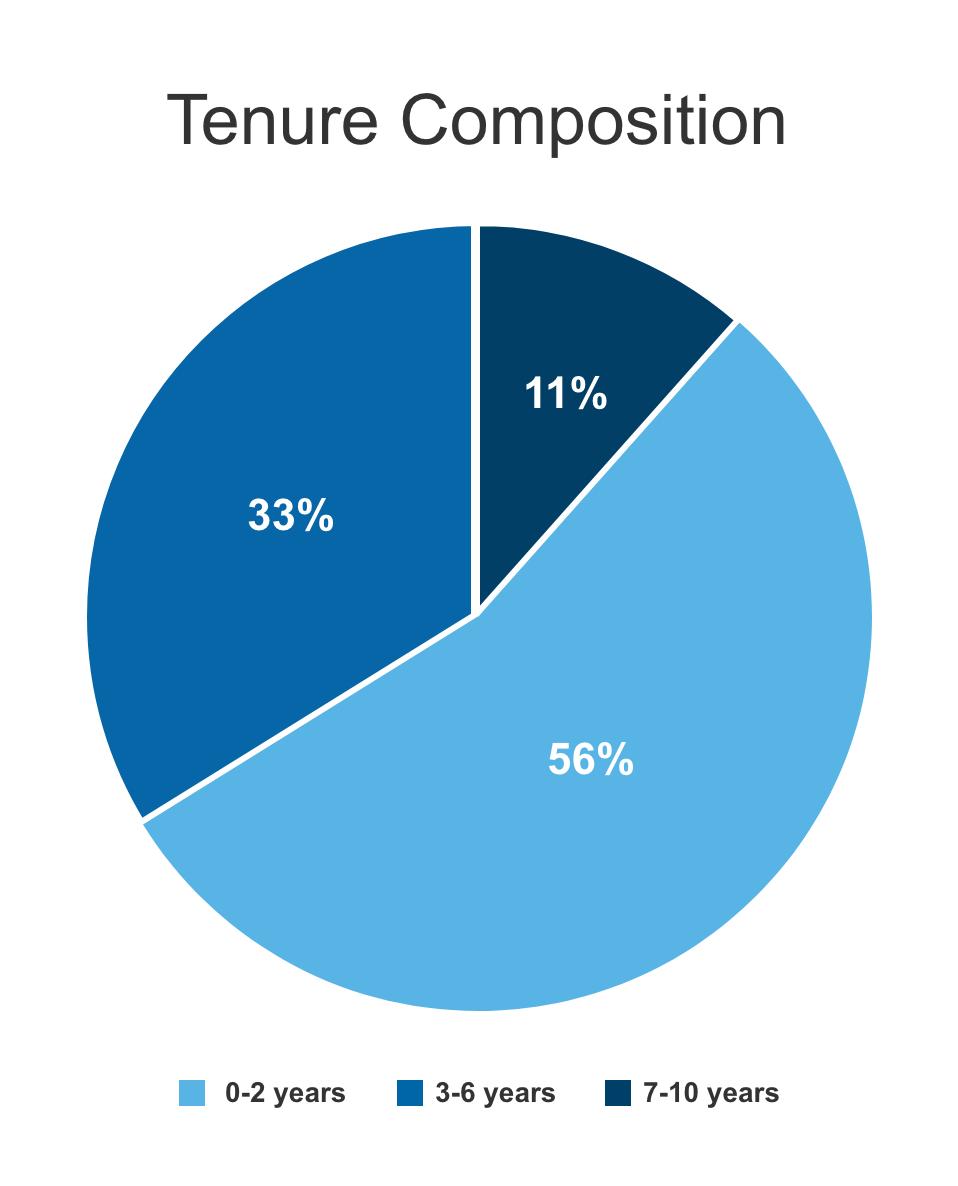
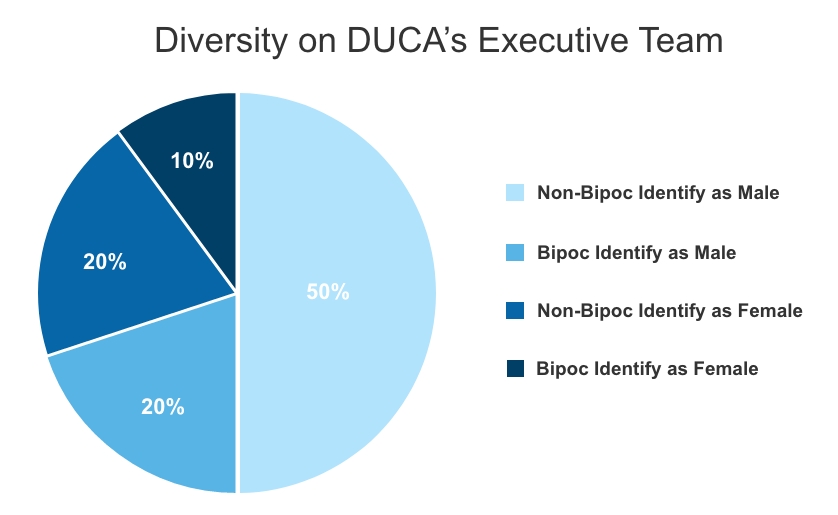
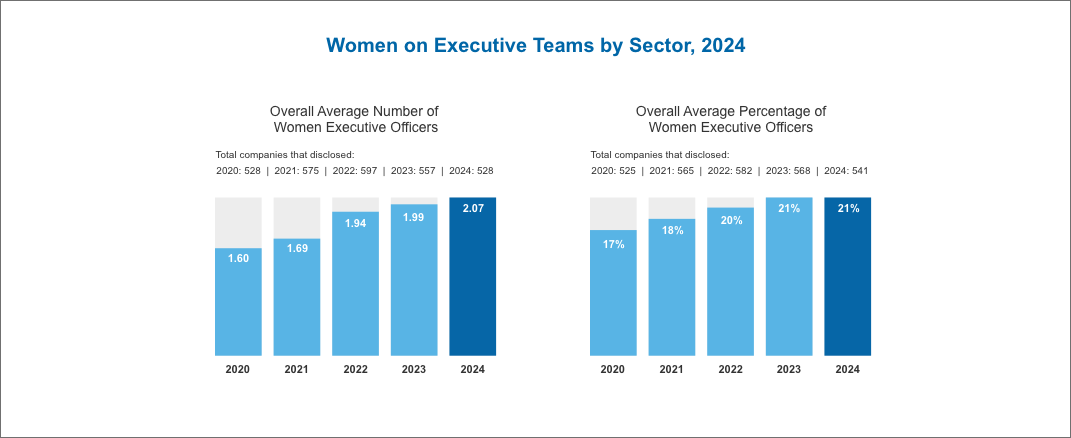
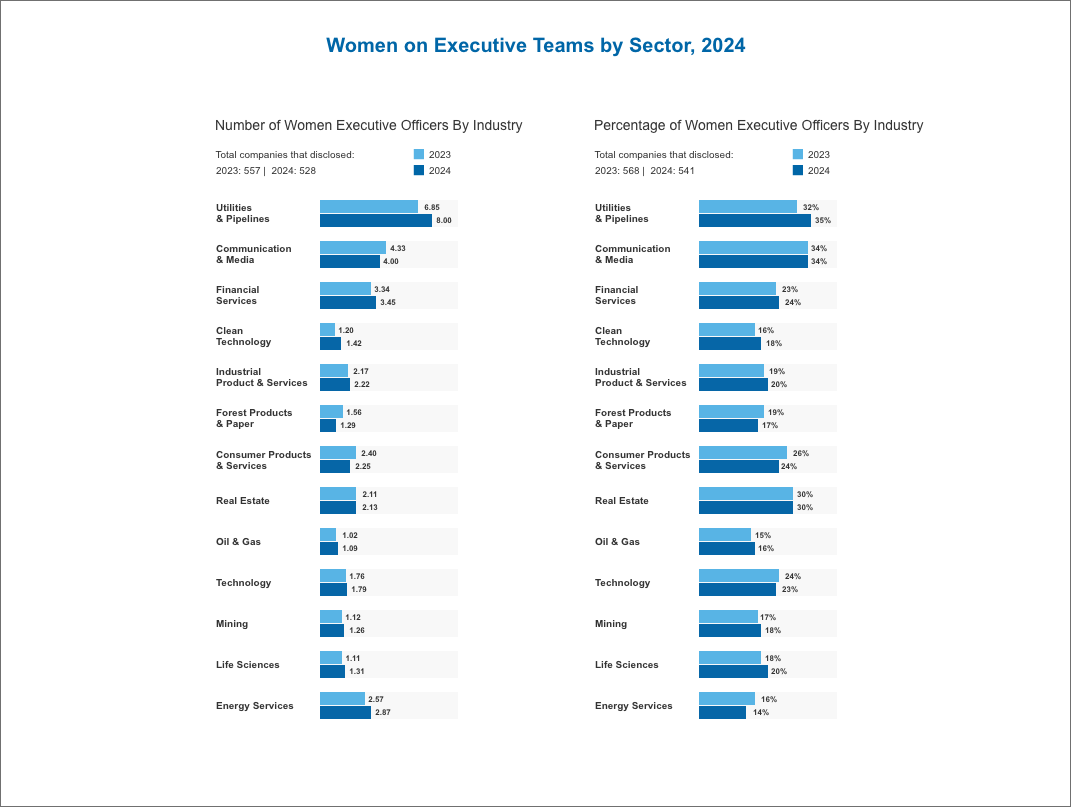
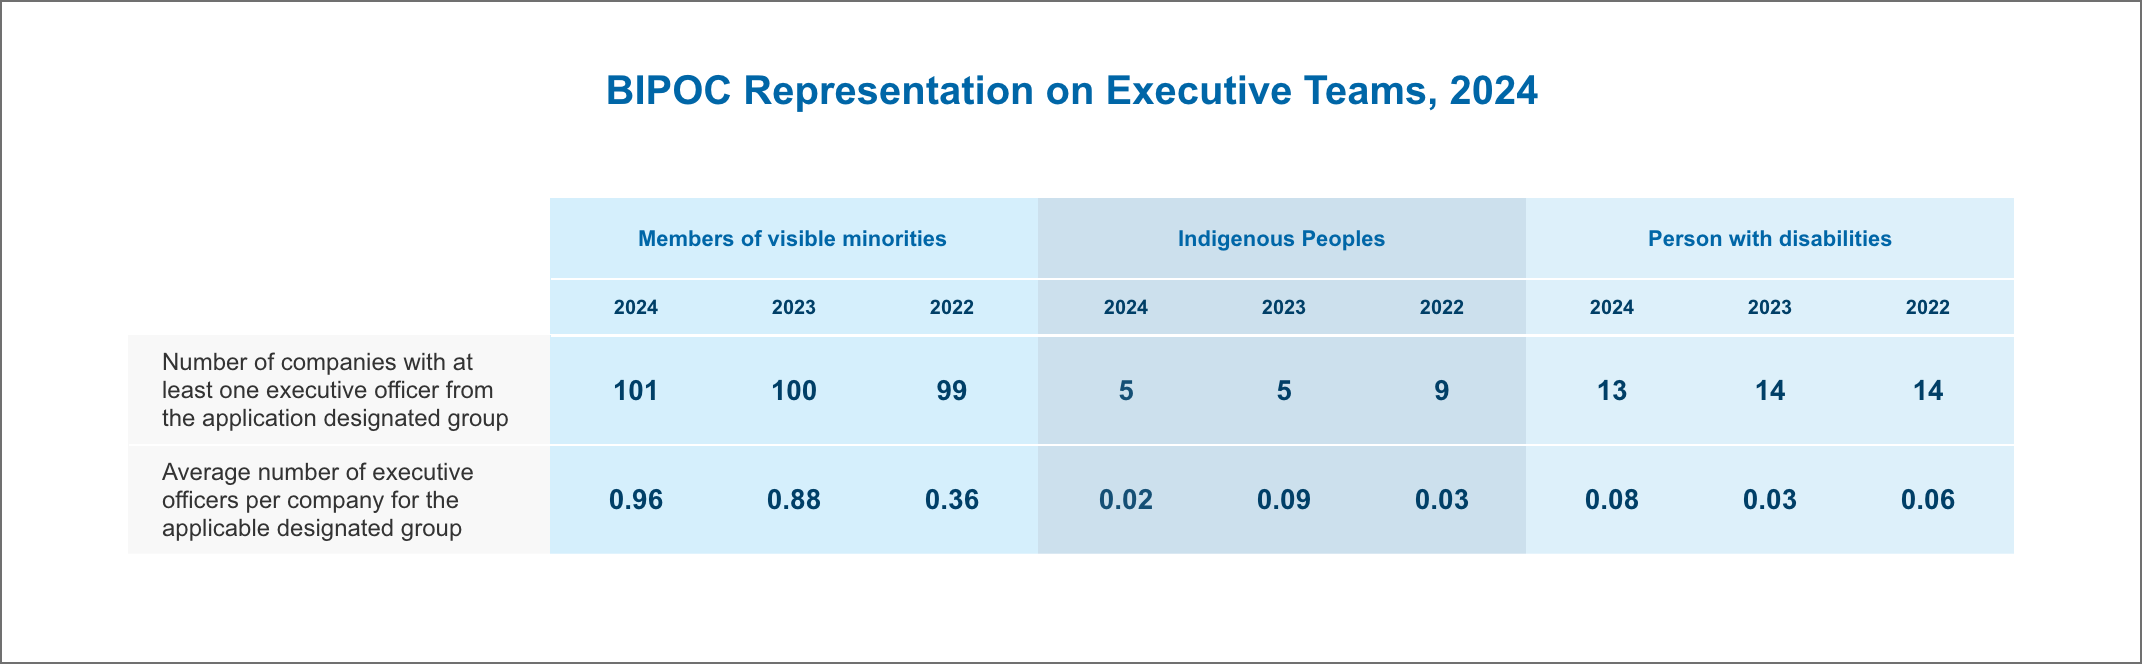
DUCA’s Board recognizes that diversity is important in ensuring its Directors possess the qualities, attributes, skills, education, and experience required to effectively steward and oversee the strategic direction and management of DUCA. The Board recognizes the benefits of diversity, equity, and inclusion toward attracting high-caliber Directors and maintaining a high functioning Board. Diversity, equity, and inclusion enables diversity of thought, as such the Board considers diversity as an important factor in the optimal composition of the Board and its Committees. Board gender diversity and tenure DUCA
Source: https://www.osler.com/wp-content/uploads/2024/09/Diversity-Disclosure-Report-2024-EN-270924.pdf
Source: https://www.osler.com/wp-content/uploads/2024/09/Diversity-Disclosure-Report-2024-EN-270924.pdf
Source: https://www.osler.com/wp-content/uploads/2024/09/Diversity-Disclosure-Report-2024-EN-270924.pdf
DUCA’s purpose is to help People, Businesses and Communities do more, be more and achieve more. Underpinning this purpose is the philosophy and belief that cooperative banking can be a powerful force for social good. This means our approach to ESG is informed by and integral to DUCA’s purpose and mission as a Credit Union. Our focus is also shaped by the priorities of the social and environmental landscape in which we operate including climate change, matters of diversity, equity and inclusion and the financial well-being of the Communities we serve. Going forward DUCA will progressively build on our ESG strengths through further refinement and amplification of goals, initiatives and measurements and a governance framework that continues to evolve and support DUCA’s environmental and social impact.
The Board provides oversight to DUCA subsidiaries at an enterprise level in accordance with DUCA’s Enterprise Risk Management policy requirements for subsidiary governance which comply with the FSRA Sound Business and Financial Practices Rule. DUCA’s subsidiary governance policy and framework enables the Board’s oversight through defined procedures and practices along with mechanisms for informing the Board of subsidiary level risks, compliance and governance matters as well as reporting on the subsidiary’s business and financial performance.
DUCA’s Board of Director remuneration is in accordance with its Member approved bylaws and Director Compensation and Expenses policy which adheres to FSRA’s Sound Business and Financial Practices Rule. The Board’s philosophy and approach to Director remuneration recognizes the importance of sound corporate governance as a key ingredient to corporate success. As such, it is important that DUCA’s remuneration for Directors is commensurate, fair and reasonable when compared to organizations of similar size, complexity and risk profile within the Credit Union sector. Accordingly, DUCA’s Board of Directors are remunerated at approximately the 50th percentile of Director remuneration for comparable organizations, with due consideration given to the required skills, education, experience, and commitment given DUCA’s nature, size, complexity, operations, and risk profile. The Governance Committee of the Board reviews Director remuneration at least every three years.
The Human Resources and Compensation Committee (HRCC) of the Board governs and oversees the remuneration programs of the CEO, senior management, and employees of the Credit Union. The Board and the HRCC ensure that remuneration programs of the Credit Union adhere to the fair and reasonable remuneration requirements codified in FSRA’s Sound Business and Financial Practices Rule. DUCA applies its remuneration philosophy and approach recognizing that it is our people that power DUCA’s ability to fulfill its purpose and achieve its corporate aspirations. On this basis, and within the context of its governance and regulatory frameworks, DUCA’s remuneration programs for the CEO, senior management and all employees of the Credit Union are in accordance with the following principles:
Equity, fairness, and alignment with DUCA’s purpose: DUCA’s employee remuneration is aimed at ensuring remuneration is commensurate, fair, and equitable for established roles within the organization as defined by job scope, complexity, job demands, required qualifications and skills, and organizational impact. We strive to appropriately pay for performance through the evaluation of person-by-person performance level against annually established objectives. We seek to ensure all employees are compensated in a fashion that aligns with DUCA’s business and social purpose and philosophy.
Market competitiveness: Employee remuneration is geared to attract and retain the talent necessary to enable DUCA’s ongoing strategic success and to support sustainable talent development and organization succession planning. Accordingly, DUCA’s employee remuneration takes into account market pay for similar or equivalent roles at comparable organizations taken from the Credit Union and financial services sectors.
Alignment to corporate goals and objectives: Remuneration frameworks are designed to support and encourage strong performance and commitment to the Credit Union and incentivize activity that achieves DUCA’s organizational goals, objectives, and sound business and financial practices. Ultimately, this alignment enables delivering the best possible outcomes for Members and our stakeholders.
Consistent with DUCA’s remuneration philosophy and approach, base salary takes into consideration market factors including pay competitiveness as well as factors such as complexity, required qualifications and skills, demands of the role and organizational impact. Salary is reviewed annually and adjusted as appropriate, with a comprehensive market-based review performed at least every three years.
DUCA’s variable compensation for the CEO and Senior Management comprises a short-term incentive plan (STIP) and long-term incentive plan (LTIP). Both plans are paid contingently upon the degree of achievement against Board approved business performance targets.
Short-term incentive plan (STIP): DUCA’s STIP links compensation to the achievement of annual performance objectives. The plan has two components:
- Personal performance based on an evaluation of delivery against annually established performance objectives at the individual level.
- Business performance, which is based on specific, board approved business performance targets linked to DUCA’s Annual Operating Plan (AOP).
The level of personal and business performance in a fiscal year relative to personal objectives and business performance targets determines the total amount of STIP paid. An illustration of the STIP payment formula for eligible employees is as follows: STIP = 1. bonus eligible earnings x 2. target bonus % based on job grade x 3. business performance result (ranging from a minimum of 0% to a maximum of 125%) x 4. personal performance result tied to achievement of individual objectives (ranging from a minimum of 0% to a maximum of 150%). The STIP is applicable to all eligible employees at DUCA. STIP payable for the CEO and oversight roles of Chief Risk Officer and Chief Financial Officer, is subject to an additional regulatory compliance factor which ranges from a min of 0% to a max of 100%.
The annually approved business performance target component of the STIP covers four dimensions of business performance: profitability, Member satisfaction, business diversification, and business growth.
Long-term incentive plan (LTIP): DUCA’s LTIP is established and approved by the Board annually and links compensation of the CEO and eligible members of senior management to the achievement of longer-term strategic objectives. LTIP is paid at the end of a three-year performance period contingent upon the achievement of three-year forward looking business performance outcomes relative to Board approved performance targets as per DUCA’s three-year strategic plan. The LTIP is based upon a target percentage of base salary for each of the CEO and eligible members of senior management determined by job grade. An illustration of the LTIP payment formula is as follows: LTIP payable at the end of a three- year performance cycle = 1. Base salary x 2. LTIP target award for a specific job grade x 3. Business performance outcomes relative to three-year forward looking business performance targets (ranging from a min of 0% to a max of 125%).
The annually approved, three-year forward looking LTIP business performance targets cover dimensions of business performance such as: cumulative profitability, assets under management (AUM), and capital ratio at the end of a performance cycle.
Proportion of CEO remuneration at-risk: The combination of CEO base salary, LTIP and STIP which are contingent upon meeting performance objectives, results in approximately 50% of the CEO’s total remuneration being “at-risk”.
Retirement benefits: A defined contribution pension plan is available for all eligible employees at DUCA. The degree of employer contribution and/or employer matching is determined based on job grade and applicable base salary. DUCA contributes 10% of base salary towards the CEO’s retirement savings.
Benefits and perquisites: DUCA provides a market competitive benefits program to all eligible employees covering health, dental, disability, life and accidental death and dismemberment insurance as well as market competitive vacation leave, employee and family assistance and personal leaves. The CEO, eligible members of senior management and vice presidents of DUCA also have access to additional health benefits including an annual health assessment and year-round care for urgent medical attention. The CEO is provided an allowance for expenses such as vehicle and commutation costs.
Details of the annual remuneration for the CEO and top remunerated members of senior management are available in the disclosures included in DUCA’s annual audited financial statements.


